
Ten hubs, one morning: why big delivery networks plan hub by hub
Saudi delivery orders grew 49% in a year. The operators keeping up split the day by hub, and the routing research and Amazon’s own network say they’re right to.
By Kyla Smith
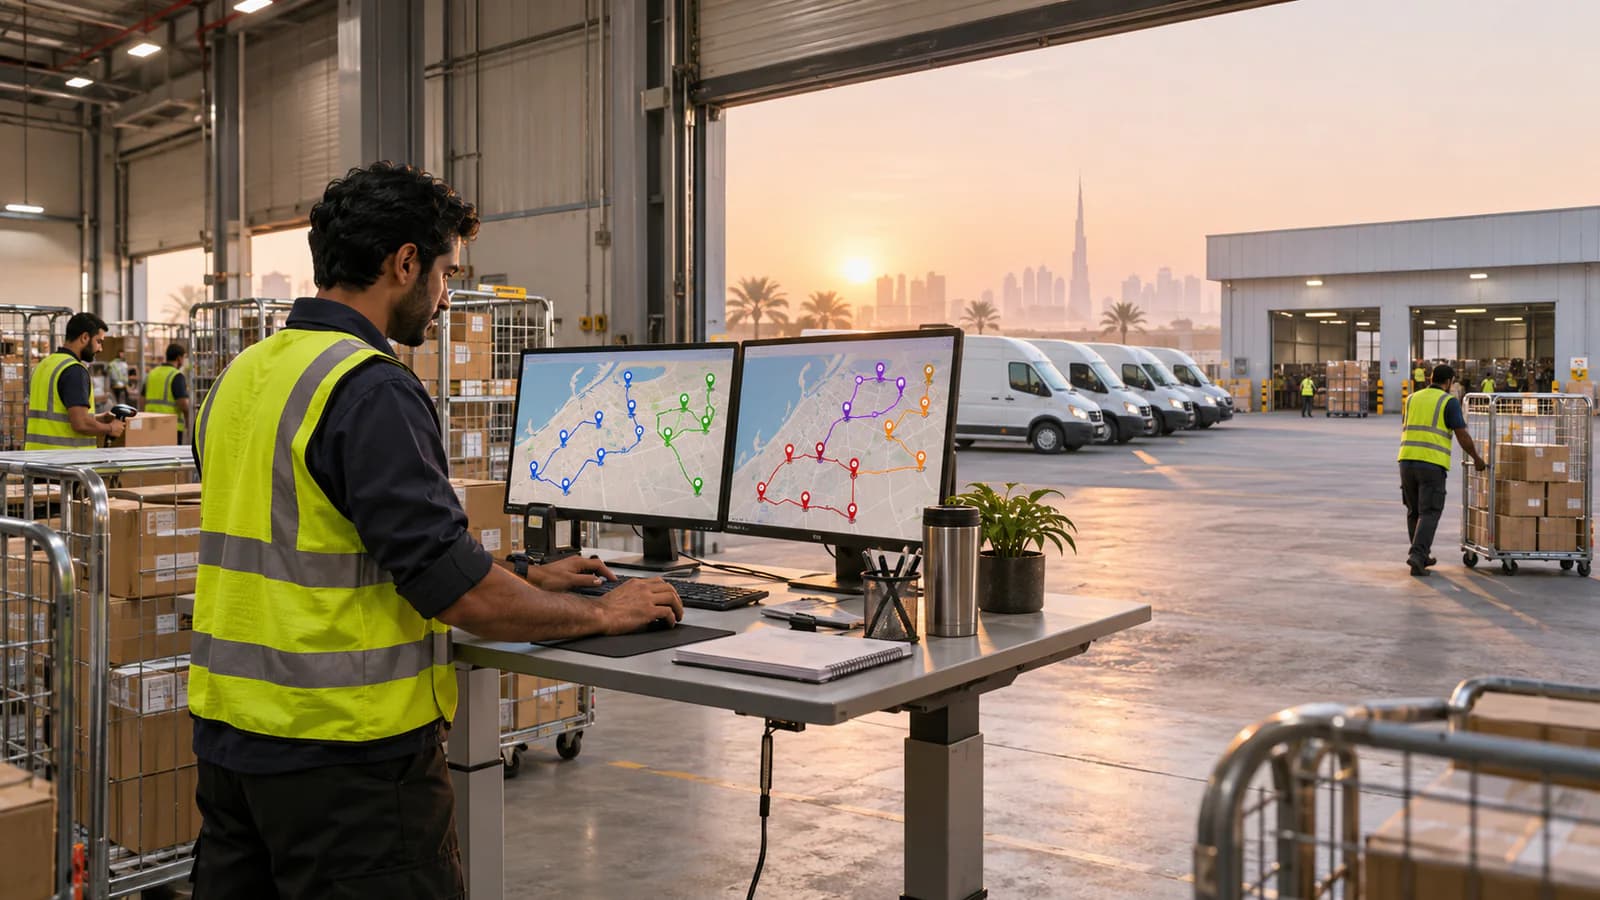
118M
Saudi delivery orders in Q1 2026, up 49% on a year earlier
Transport General Authority, 2026
19%
fewer miles to deliver packages after Amazon split its US network into 8 regions
Amazon, Q2 2023 earnings call
30,000
customers: the size of routing problem researchers break into clusters to solve
Arnold et al. 2019, via Kerscher & Minner 2024
6:40 am. Two planners, two hubs, one company. At the north hub, Sara sees a heavy morning and raises the maximum number of vans from twelve to sixteen. Forty minutes’ drive away, Omar starts the south hub’s run a few minutes later. It picks up sixteen too, because the setting was never Sara’s. It belonged to the whole company.
Nobody did anything wrong. The south hub now has four more routes than it has drivers, and somebody spends the next half hour pulling them apart before the vans can load. The setup assumed one planner, one plan, one morning. The network stopped looking like that a while ago.
The volume is already here
Saudi Arabia publishes the clearest numbers in the region. The Transport General Authority counted 79.6 million delivery orders in the first quarter of 2025, up 22% on a year earlier. The next quarter passed 101 million. The fourth quarter passed 124 million, up 60% year on year. The first quarter of 2026 came in at more than 118 million, up 49%, and the second quarter at more than 132 million, up 30.5%.
The orders are not in one place. In the first quarter of 2026, the Riyadh region took 44% of them, Makkah 22.21% and the Eastern Province 16.23%. Those are three regions hundreds of kilometres apart. No single hub serves all three on the same day, so any operator working at national scale is already running several hubs, whether or not its planning treats them that way.
One caution on the numbers. “Delivery orders” is one of the authority’s measures. It also publishes a separate count of parcel shipments, which passed 57 million in the fourth quarter of 2025. They measure different things, so they should not be added together or compared as if they were one series.
79.6M
Saudi delivery orders, Q1 2025
Transport General Authority
124M
Saudi delivery orders, Q4 2025
Transport General Authority
132M
Saudi delivery orders, Q2 2026
Transport General Authority
Distance is decided by the hub, not the route
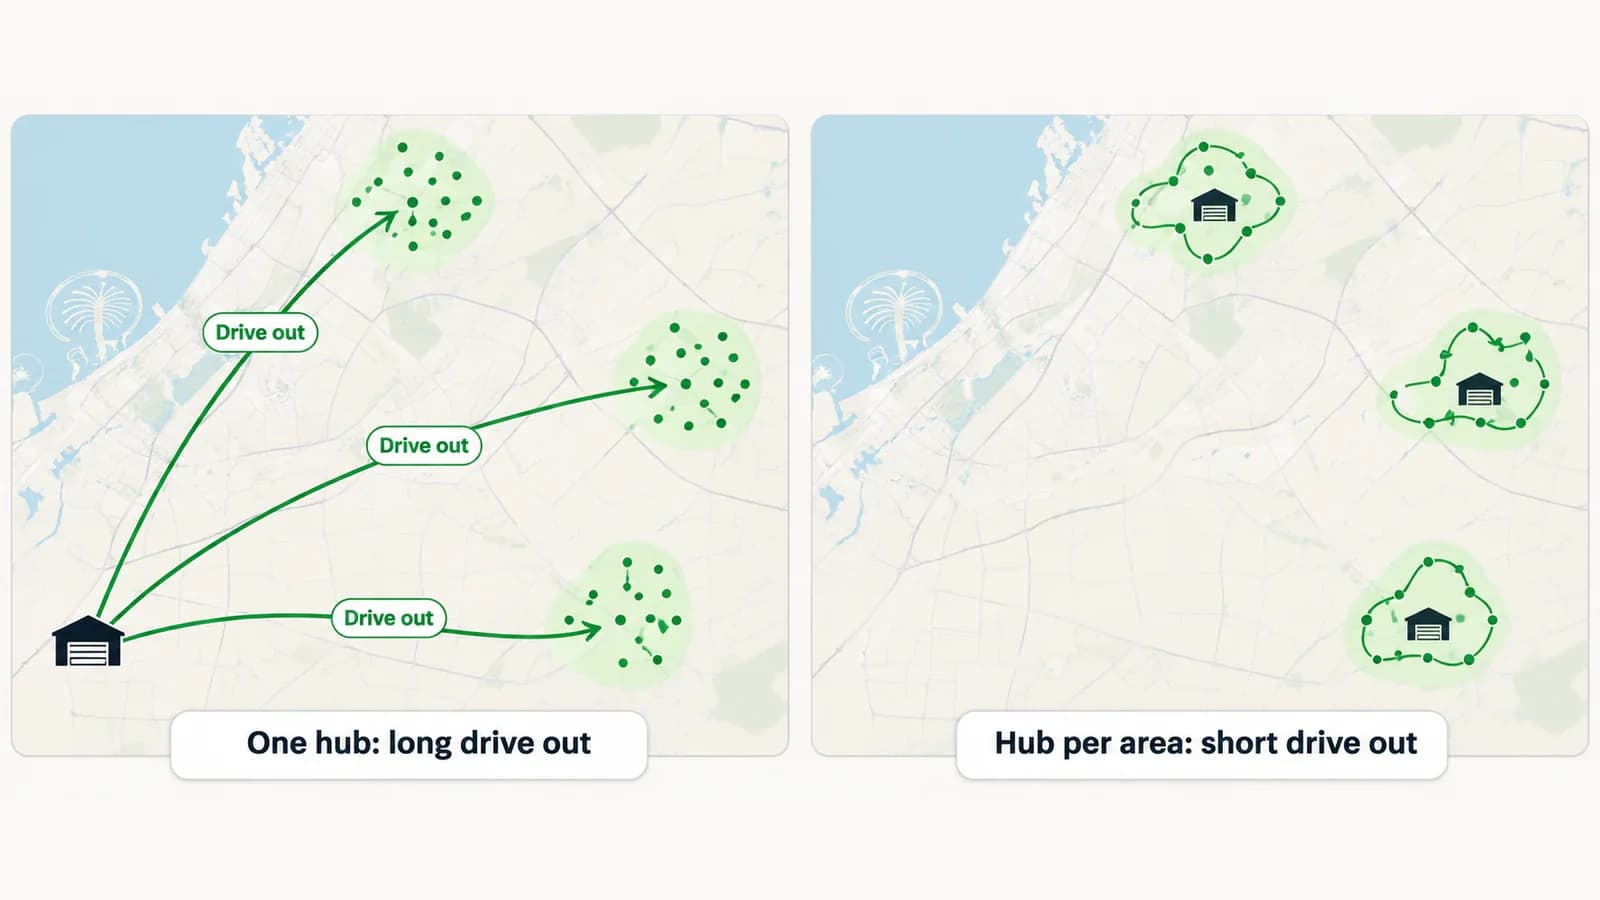
In 1984, Carlos Daganzo published a simple formula for the distance a fleet drives to serve a depot and the area around it, built to mimic what dispatchers actually do: split the area into districts, then route each one. It is still the standard back-of-envelope model. The distance has two parts. One is the trip from the depot out to the district and back. The other is the tour between stops once the van is there.
A better sequence only touches the second part. The first is set by where the hub sits relative to the stops. Plan a Dammam district from a Riyadh hub and no amount of route tuning will win back the drive out.
The largest example of moving hubs closer is Amazon’s. On its second-quarter 2023 call, Amazon said it had changed its US network from one national network to “a series of eight separate regions serving smaller geographic areas.” It reported a 20% reduction in touches per delivered package, a 19% reduction in miles travelled to deliver packages to customers, and 76% of deliveries now fulfilled within region. Its 2023 shareholder letter says regionalisation “trimmed transportation distances, helping lower our cost to serve.” Two caveats: these are Amazon’s own figures, and they cover a whole fulfilment network, where to keep stock as well as how to drive, not last mile alone.
Closer to home, Shipa, Agility’s delivery company, says it runs more than 18 hubs and 500+ delivery vehicles in Saudi Arabia. When it announced a Jeddah gateway in October 2024, alongside its existing gateways in Riyadh and Dammam, it said the site would cut 12 to 24 hours from delivery times in the western part of the Kingdom. That is the company’s own projection at launch, not a measured result.
Big plans are slow plans
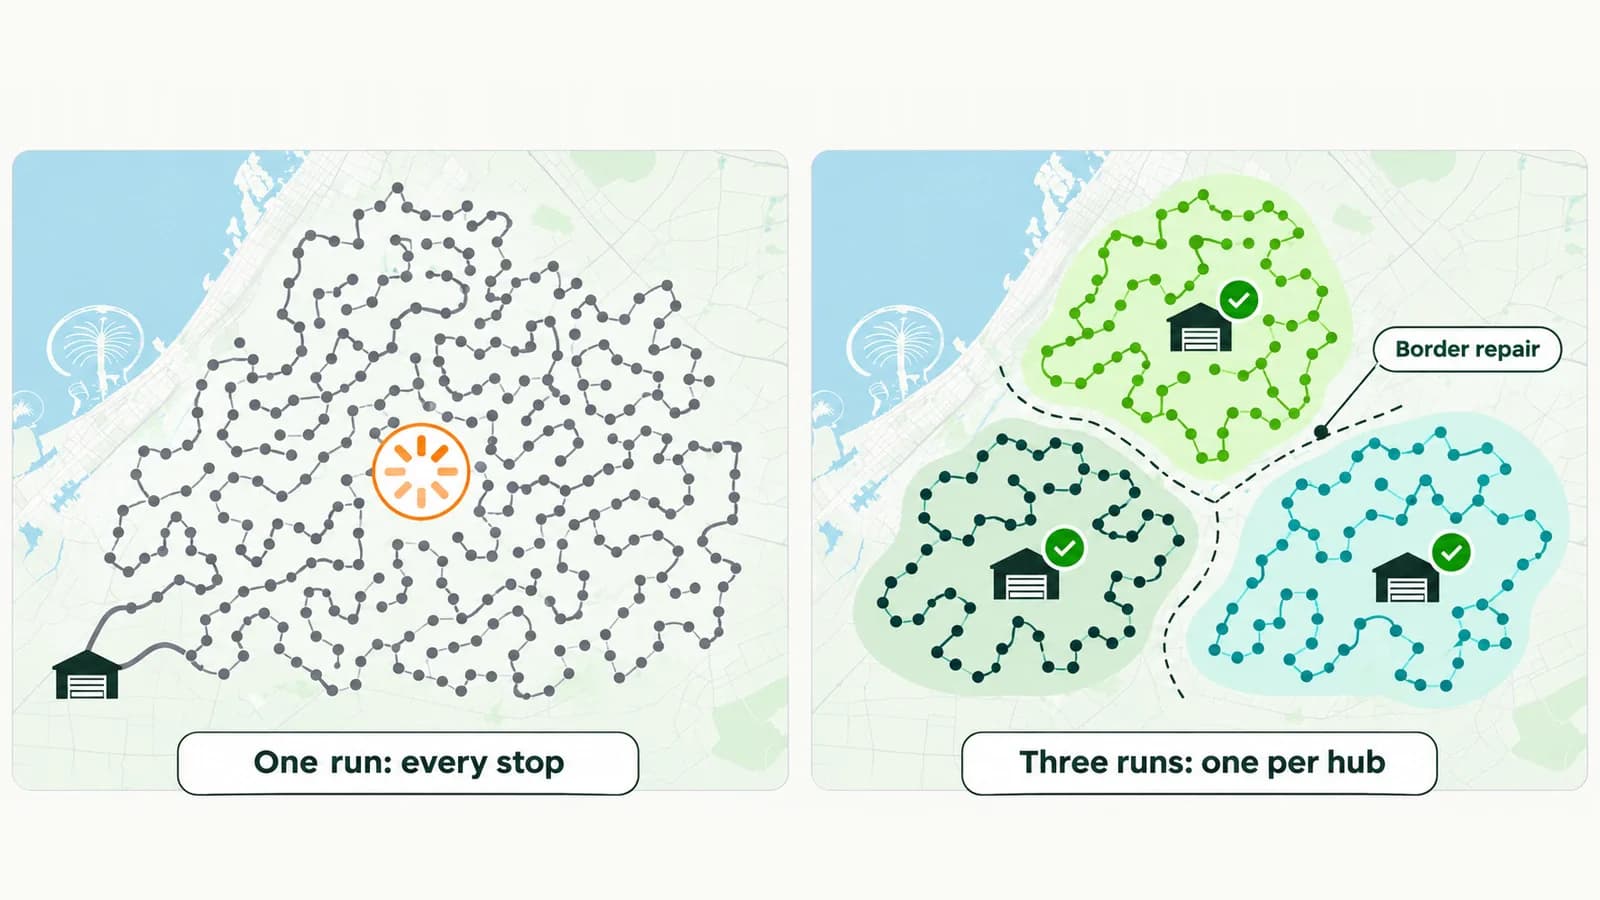
The second reason to split is time. In their 2024 paper on large routing problems, Kerscher and Minner put it plainly: “The number of possible routing options increases exponentially with the number of customers involved.” For large problems, they write, exact methods are impractical.
So researchers split. The same paper cites Arnold and colleagues, who in 2019 solved routing problems with up to 30,000 customers, built on real data from daily parcel delivery in Belgium. Kerscher and Minner’s own method groups customers into clusters by place, time window and demand, solves each cluster on its own, then runs a repair step that “resolves unfavorable routing decisions at the perimeters of the subproblems.” They report that it beats the classic cluster-first, route-second approach on test sets of 600 to 1,000 customers.
A hub is the cluster planners already work in. Its stops are close together, its drivers start from the same yard, and its morning has one cut-off. Planning it as its own run is the operational version of what the research does on purpose. Routing from several depots is a field of its own, too: a 2015 survey of multi-depot vehicle routing reviewed papers published between 1988 and 2014.
What we could not find is an independent study that measures how much faster hub-by-hub planning is in a real operation, as opposed to on research test sets. The vendor claims we found are vendor claims, so we are not quoting them. The direction is clear; the size of the gain in your network is something to measure.
Where hub-by-hub planning breaks
Splitting the plan fixes the size problem and creates a different one: everything the hubs share. None of what follows comes from a study. It is what we have seen go wrong in operations that moved from one plan to several.
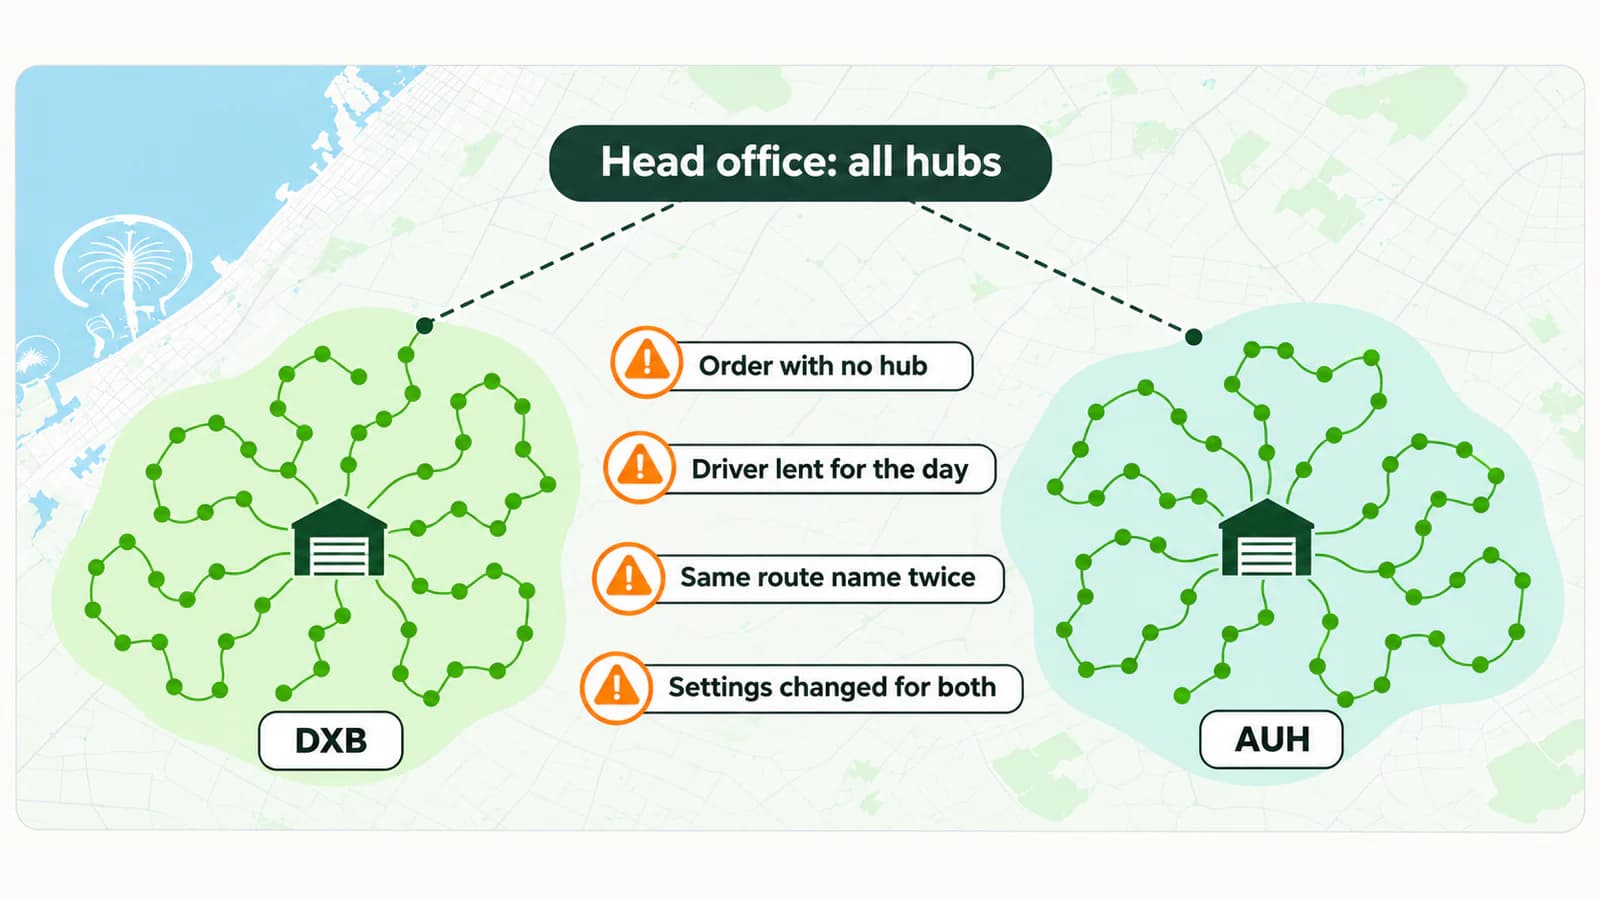
Orders with no hub. An order arrives from a new merchant, an old integration or a spreadsheet upload, and nothing says which hub it belongs to. It sits in a list nobody owns until a customer calls.
Merchants that span hubs. One merchant ships from one warehouse to customers served by three hubs. Its pickups belong to one hub and its drops to others, and the cut-off it was promised has to hold in all of them.
Drivers lent between hubs. A short-staffed hub borrows two drivers for the day. If the loan is not recorded, both hubs plan around them, or neither does.
Settings one hub changes for all. The problem this post opened with. Van limits, shift lengths and service times set at company level get changed by whichever planner is up first.
Route names that collide. Two hubs each have a route called R5. The driver app, the customer message and the end-of-day report all say R5, and nobody can tell which one was late.
Head office loses the single view. Each hub sees its own day clearly. The operations director now has to open a screen per hub, or wait for a spreadsheet from each, to answer how the network is doing.
What to set up
- Tag every order to a hub at intake, from the address or the merchant, with one default hub for anything that does not match.
- Plan each hub as its own run, and let every hub plan at the same time without waiting for the others.
- Keep limits such as vans, shift length and service time with the run, so one hub’s busy morning does not change another’s.
- Give each driver a home hub for the day, and make lending a driver to another hub a deliberate, recorded step.
- Put the hub in the route name, so R5 at one hub is never confused with R5 at another.
- Give head office one view across every hub, read-only if that keeps planners in charge of their own day.
- Measure on-time rate, failed deliveries and kilometres per stop by hub, not only for the network, so a weak hub cannot hide in a good average.
Sources
- Transport General Authority, Q1 2025 delivery orders, via Riyadh Daily, 20 May 2025. Link
- Transport General Authority, Q2 2025 delivery orders, via Argaam, 21 July 2025. Link
- Transport General Authority, Quarterly Statistical Bulletin, Q4 2025 delivery orders, via Sharikat Mubasher, 13 January 2026, and Saudi Press Agency. Link · SPA
- Transport General Authority, Q1 2026 delivery orders and regional shares, via Arab News, 21 April 2026. Link
- Transport General Authority, Q2 2026 delivery orders, via Saudi Gazette on Zawya, September 2026. Link
- Saudi Press Agency, Transport General Authority parcel delivery complaint index for Q4 2025 (parcel shipments). Link
- Daganzo, C. F., “The Distance Traveled to Visit N Points with a Maximum of C Stops per Vehicle: An Analytic Model and an Application,” Transportation Science 18(4), 331–350, November 1984. Link
- Amazon.com, Q2 2023 earnings call, 3 August 2023, transcript via The Motley Fool. Link
- Amazon, Andy Jassy’s 2023 letter to shareholders, April 2024. Link
- Shipa Delivery, news release on its Jeddah gateway, 22 October 2024 (company figures). Link
- Kerscher, C. and Minner, S., “Spatial-temporal-demand clustering for solving large-scale vehicle routing problems with time windows,” arXiv:2402.00041, January 2024. Cites Arnold et al., “Efficiently solving very large-scale routing problems,” Computers & Operations Research 107, 32–42, 2019. Link
- Montoya-Torres, J. R. et al., “A literature review on the vehicle routing problem with multiple depots,” Computers & Industrial Engineering 79, 115–129, January 2015. Link
If you run more than one hub and want each planner to plan their own, let’s meet.
Let’s meet